We (Project Managers, Program Managers, Portfolio Managers, Team Leads, Subject Matter Experts and
Functional Managers of Project Team Members) tend to develop product development plans by
estimating specific (or deterministic) timelines for completing the individual tasks, then linking them
together to generate the project schedule. We typically commit to these timelines (irrespective of
single-point estimation inaccuracies), and always expect that a good team of people will deliver as
estimated/planned. Now, when the stakes increase and schedule execution becomes imperative (as
indeed happens more and more, for our competitive world is always trying to “Do More with Less” to
gain business advantages over others), do we always come through? Probably not as much as we would
like. We will now investigate some of the usual culprits, and how to use SRA tools to counter them.
The time it takes to perform a project task (i.e., the task duration) can vary considerably due to many
factors (e.g., performance inefficiencies, scope omission, poor estimation assumptions, differences in
resource capability, technological hurdles, etc.). The best-case durations are influenced by
Opportunities and the worst-case durations are influenced by Risks. In today’s highly competitive
environment, our plans tend to carry a lot of risk, and our nominal single-point estimates tend to be as
well. Thus, using an SRA tool with relatively simple triangular probability distribution functions based on
best-case, nominal and worst-case duration estimates can help combat this issue.
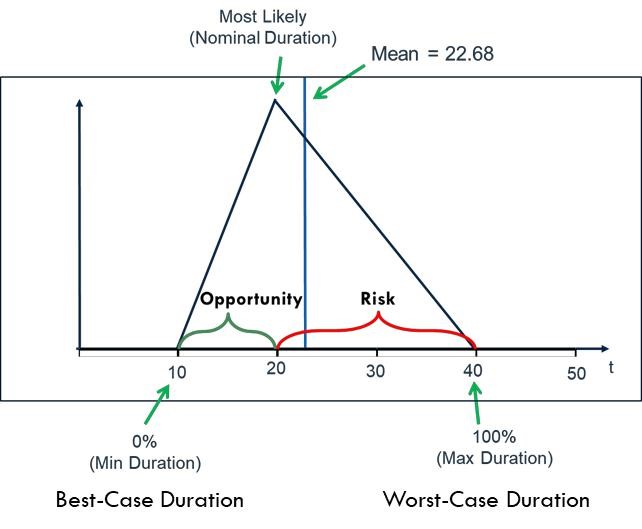
If we estimate the nominal, best-case and worst-case durations to complete a task, we can create a
triangular distribution for all likely task durations. To do this we plot the best-case duration on the x-axis
(time) with “0” y-axis value, the nominal duration has a positive y-axis value, and the worst-case
duration has a “0” y-axis value. Connecting the three values creates a triangle – the task duration PDF
(Probability Density Function). An example is shown below.
Unless we are very conservative estimators and/or our organization is not striving to “Do More with
Less”, our estimates usually have less opportunity (nominal duration minus best-case duration) than risk
(worst-case duration minus nominal duration). This means our PDFs are inherently skewed in the wrong
direction – i.e., the “opportunity area” of the triangle is less than the “risk area”. Dividing the
“opportunity area” by the “risk area” is the % Confidence for completing that task on or before the
nominal duration estimate, and it is usually less than 50%. When we cascade this effect through the
schedule network the resulting nominal end-date (per the critical path) is typically far less than 50%
confidence – for real complex projects it is likely to be less than 1% confidence.
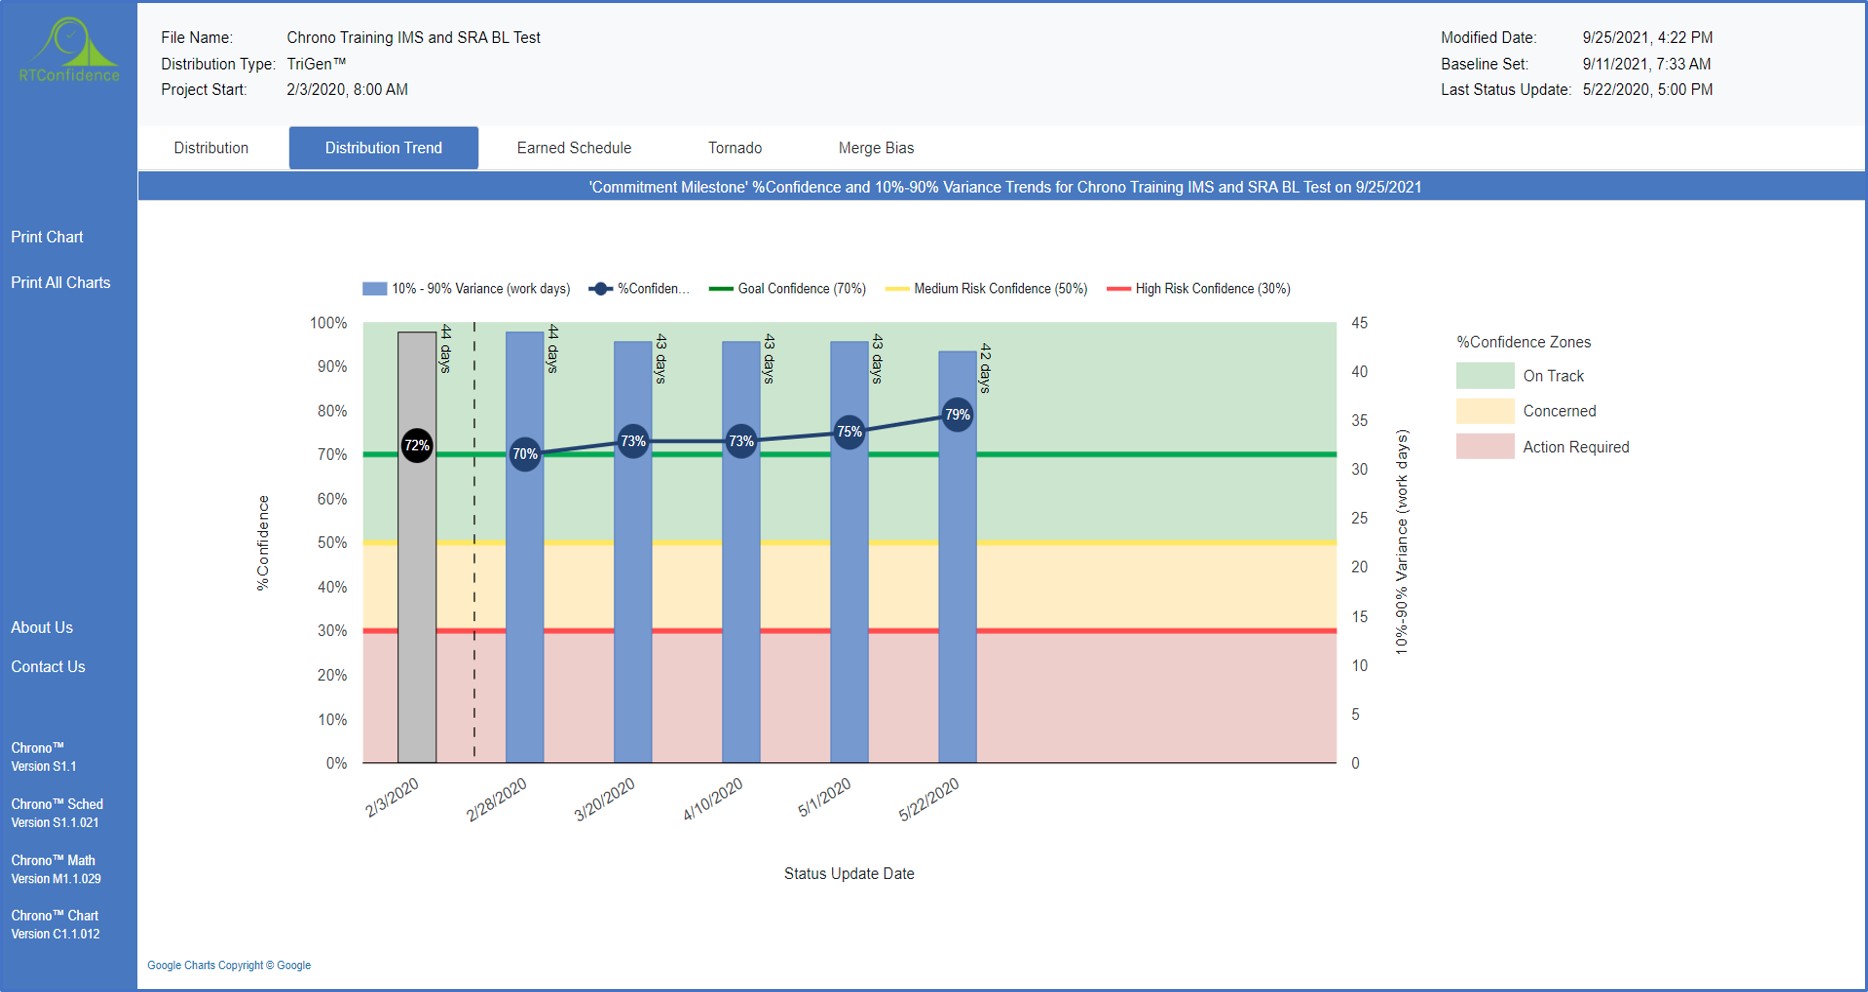
There is another phenomenon that skews (in a negative way) project schedules as well – it is commonly
referred to as “merge bias”. This relates to the merging of two or more schedule paths into a common
subsequent task start milestone. The closer the paths are to being to the critical path the more
pronounced the effect on the % confidence of the completion milestone.
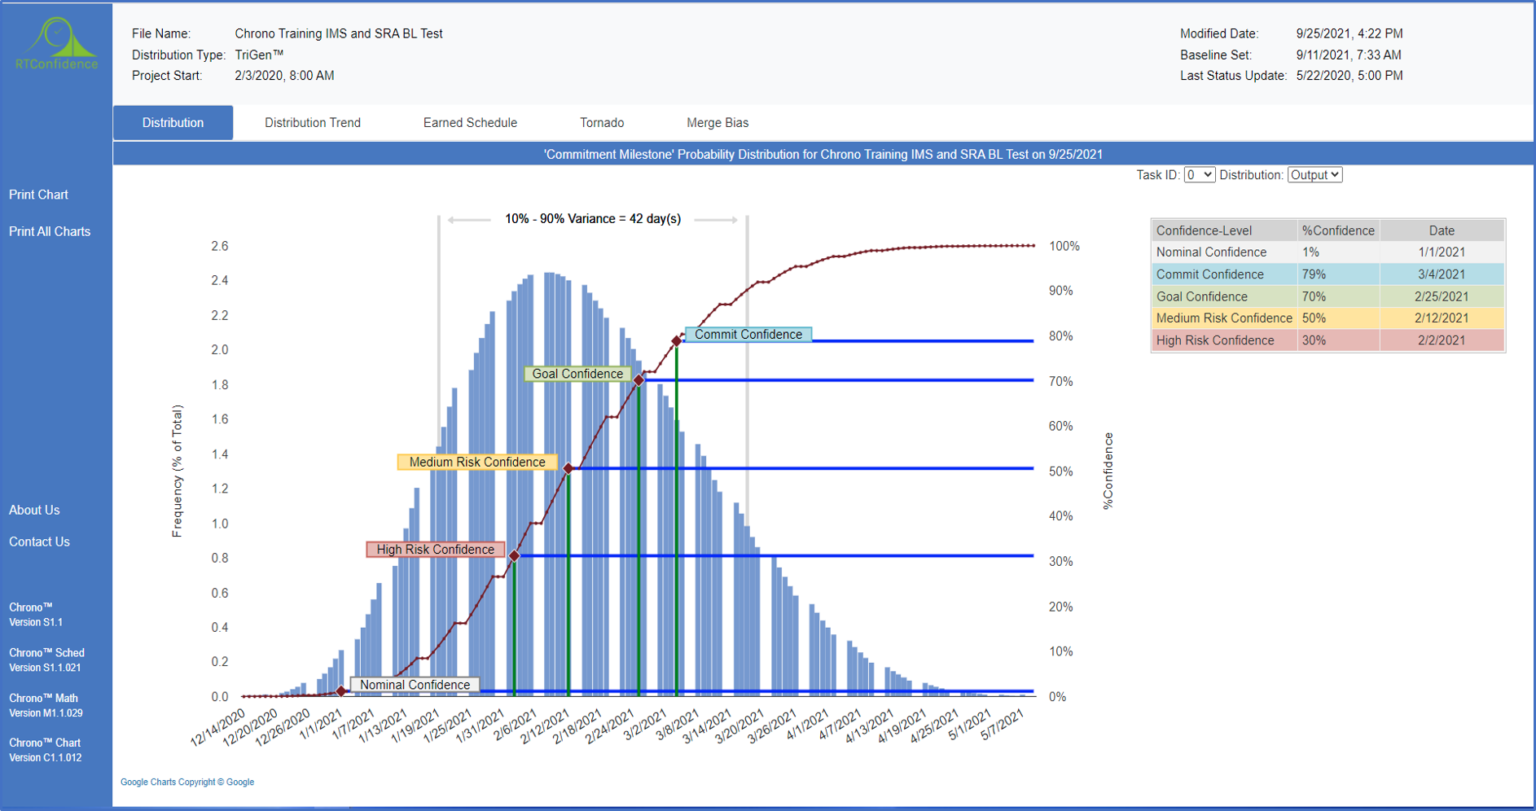
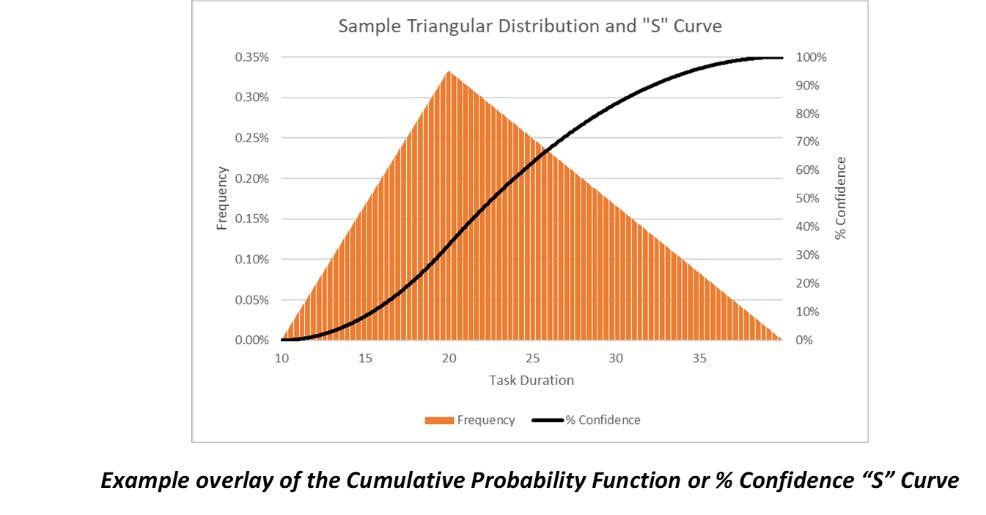
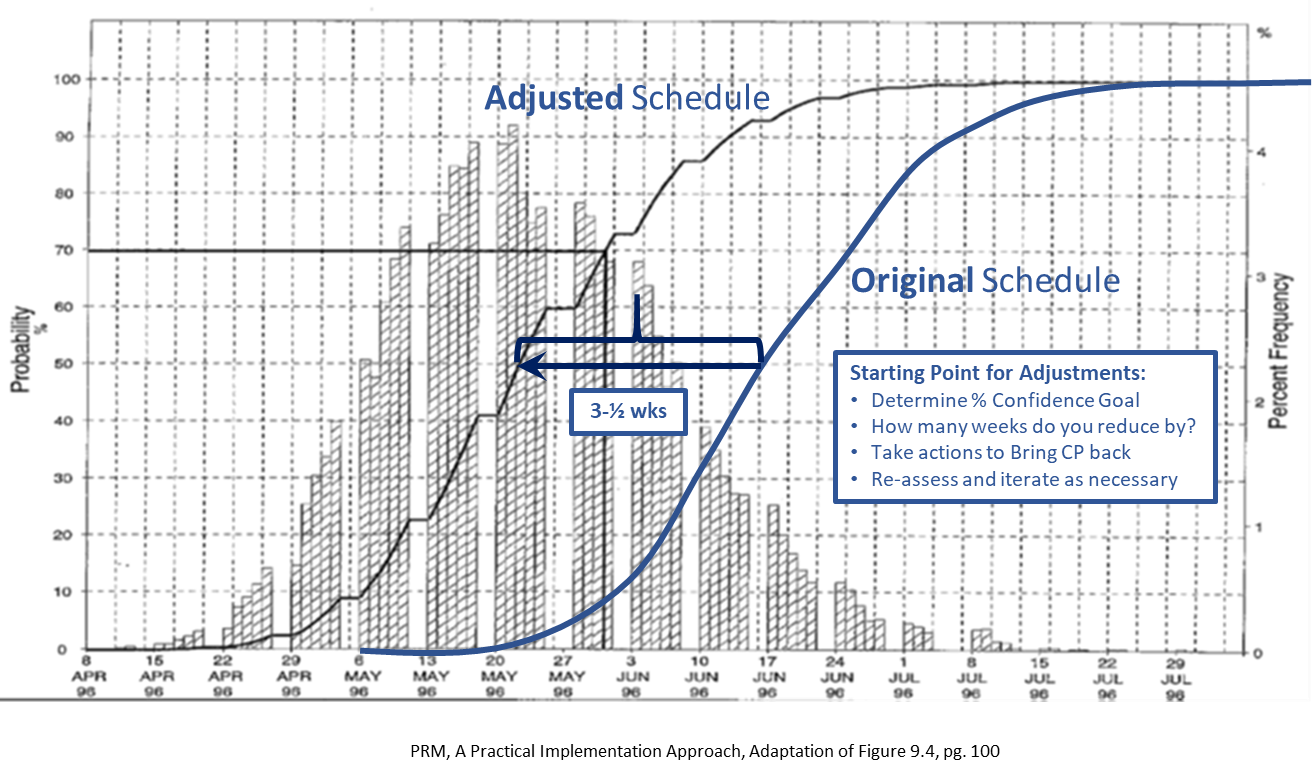
The good news is that from these triangular task duration PDFs we can derive the completion milestone probability distribution, or ‘S’ Curve (% confidence as a function of completion time/date) using an SRA Modelling and Simulation tool. We can make use this tool to either (A) make higher probability commitments by pushing out the commit date(s), or (B) conduct “what-if” analyses and evaluate/implement proactive risk response actions to increase our confidence level. Suffice it to say, using an SRA tool can effectively lead to determination of an achievable (e.g., >50% confidence) project schedule plan. This facilitates the evaluation of alternative improvement plans and improves the likelihood of project success. It also provides the organization’s management team with an understandable metric that effectively communicates overall project schedule risk via % confidence.